To achieve single cell resolution, NanoString developed another platform, CosMx SMI (Single Molecule Imaging), with a resolution of 1um, enabling it to detect transcripts at the subcellular level. The main limitation of CosMx is that it is constrained to ~1000 probes in each panel. This requires one to customize the probe set for each study based on data generated from the GeoMx platform. This can drive up costs and time needed to complete a study as it requires the use of two platforms. Similarly,10X Genomics also developed a newer platform, Xenium. It utilizes a probe that binds to its target on two ends, which is required for amplification. By having a two-binding site requirement, it increases specificity to each transcript. Multiple probes per gene can be used to go beyond gene expression and detect isoforms and SNPs. Like NanoString’s CosMx technology, Xenium can resolve transcripts at the subcellular level. The major disadvantage of the Xenium platform is that it can only analyze about 400 genes at a time, or less if multiple probes are used per gene.
Another technology that emerged around this time, MERFISH (Multiplexed Error-Robust FISH), is based on a much more robust ISH mechanism stemming from Femino et al’s work in 1998 on the detection of single β-actin transcripts (15). This approach named smFISH (small molecule Fluorescence ISH), used multiple fluorescently labeled probes binding to regions near the gene’s 3’ UTR and allowed for higher signal-to-noise ratio. Although smFISH has much better resolution than Visium and GeoMax, its main drawback was a very limited number of genes analyzed at a time. This is why in 2015, as a part of the Harvard Brain Science Initiative, the Zhuang Lab reported on MERFISH. Similar to smFISH, MERFISH uses a fluorescence-based barcoding scheme where multiple probes bind to a target gene, and each contain a unique binary barcode sequence. Sequential rounds of hybridization and imaging are used to read out the barcode and identify transcripts. This technology has a ∼80% detection efficiency and ∼4% misidentification rate. MERFISH has been commercialized by Vizgen under the platform name MERSCOPE. Like smFISH, MERFISH can identify transcripts at the subcellular level. Although MERFISH can identify more gene transcripts than smFISH, it is still limited to 500 genes. This represents a significant limitation for researchers as it requires nomination of candidate genes to analyze as opposed to taking an unbiased whole-transcriptome approach.
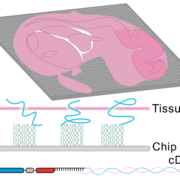
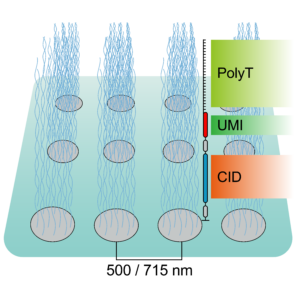
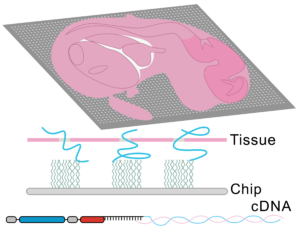
To tackle the aforementioned limitations, STEREO-Seq was launched in 2022 representing a major advance in spatial transcriptomics (16). Spatio-Temporal Enhanced REsolution Omics-Sequencing (STEREO-Seq) can analyze whole transcriptomes at best-in-class resolution of 220nm per spot. It uses DNA nanoball (DNB) patterned array chips containing a unique coordinate identifier (CID) to obtain transcript spatial information. This CID-containing oligo also contains a unique molecular identifier (UMI) and a poly-T sequence. The UMI is used to uniquely identify each molecule within each spot. The poly-T sequence is used to capture mRNA permeabilized from the tissue which next undergoes reverse transcription for cDNA synthesis. cDNAs are then sequenced using DNA nanoball sequencing (DNB-seq). This allows to obtain whole transcriptome information from individual cells within tissues at nanoscale resolution. Additionally, it allows to identify point mutations in individual cells. Compared to other high resolution spatial transcriptomic techniques, STEREO-seq gives the most complete characterization of cellular heterogeneity within a tissue. This is critical in cancer biology research for characterization of clonal tumor cell populations and the tumor microenvironment (17,18).
Taken together, spatial transcriptomics has evolved over the years to provide maximal resolution and specificity while analyzing the greatest number of genes. To date, the best platform available is STEREO-Seq, with subcellular resolution capacity and whole-transcriptome coverage.
Table summary of spatial transcriptome technologies
| CosMx SMI | GeoMx DSP | 10X Genomics
Xenium Analyzer |
10X Visium | Stereo-seq | |
| Technology | In situ hybridization + imaging | In situ capturing | In situ hybridization + imaging | In situ capturing | In situ capturing |
| Sample Type | Fresh-frozen and FFPE | Fresh-frozen and FFPE | Fresh-frozen and FFPE | Fresh-frozen and FFPE (RNA-templated probe hybridization and ligation) | Fresh-frozen |
| Capture area | 16mm2 to 375mm2 scan area | 14.6mm x 36.2mm scan area; Selected ROI of 10µm – 600µm | 12 x 24 mm scan area | 6.5mm x 6.5mm per capture area; 2 or 4 capture areas per slide | 1cm x 1cm chip (MiRXES)
(up to 13.2cm x 13.2cm) |
| Whole transcriptome sequence data | No | No | No | No | Yes |
| # of genes that can be analyzed | Pre-designed panels | Pre-designed panels | Pre-designed panels | 18,500
whole transcriptome |
Whole transcriptome |
| Resolution | Subcellular | 100 µm diameter | Subcellular | 55 µm per spot (1-10 cells) | Subcellular (220nm per spot; 400 spots per 100µm2 cell) |
| Cell segmentation and Morphological context | Nuclear stain and morphology markers | 4 color imaging to guide profiling and ROI selection (nuclear + up to 3 antibody) | H&E or IF staining | H&E or IF staining | Nuclear stain; H&E staining on adjacent sections (coming soon for the same section) |
References
- Lein ES, Hawrylycz MJ, Ao N, Ayres M, Bensinger A, Bernard A, et al. Genome-wide atlas of gene expression in the adult mouse brain. Nature. 2007 Jan 11;445(7124):168–76.
- Seydoux G, Fire A. Soma-germline asymmetry in the distributions of embryonic RNAs in Caenorhabditis elegans. Dev Camb Engl. 1994 Oct;120(10):2823–34.
- Gerlinger M, Rowan AJ, Horswell S, Larkin J, Endesfelder D, Gronroos E, et al. Intratumor Heterogeneity and Branched Evolution Revealed by Multiregion Sequencing. N Engl J Med. 2012 Mar 8;366(10):883–92.
- Deng G, Su JH, Cotman CW. Gene expression of Alzheimer-associated presenilin-2 in the frontal cortex of Alzheimer and aged control brain. FEBS Lett. 1996 Sep 23;394(1):17–20.
- Hafen E, Kuroiwa A, Gehring WJ. Spatial distribution of transcripts from the segmentation gene fushi tarazu during Drosophila embryonic development. Cell. 1984 Jul 1;37(3):833–41.
- Kornberg TB, Tabata T. Segmentation of the Drosophila embryo. Curr Opin Genet Dev. 1993 Jan;3(4):585–93.
- Emmert-Buck MR, Bonner RF, Smith PD, Chuaqui RF, Zhuang Z, Goldstein SR, et al. Laser Capture Microdissection. Science. 1996 Nov 8;274(5289):998–1001.
- Shimamura M, Garcia JM, Prough DS, Hellmich HL. Laser capture microdissection and analysis of amplified antisense RNA from distinct cell populations of the young and aged rat brain: effect of traumatic brain injury on hippocampal gene expression. Brain Res Mol Brain Res. 2004 Mar 17;122(1):47–61.
- Petroff BK, Phillips TA, Kimler BF, Fabian CJ. Detection of biomarker gene expression by real-time polymerase chain reaction using amplified ribonucleic acids from formalin-fixed random periareolar fine needle aspirates of human breast tissue. Anal Quant Cytol Histol. 2006 Oct;28(5):297–302.
- Lashkari DA, DeRisi JL, McCusker JH, Namath AF, Gentile C, Hwang SY, et al. Yeast microarrays for genome wide parallel genetic and gene expression analysis. Proc Natl Acad Sci U S A. 1997 Nov 25;94(24):13057–62.
- Whitney O, Pfenning AR, Howard JT, Blatti CA, Liu F, Ward JM, et al. Core and region-enriched networks of behaviorally regulated genes and the singing genome. Science [Internet]. 2014 Dec 12 [cited 2021 Apr 28];346(6215). Available from: https://science.sciencemag.org/content/346/6215/1256780
- Cancer Genome Atlas Network. Comprehensive molecular portraits of human breast tumours. Nature. 2012 Oct 4;490(7418):61–70.
- Ernst T, Hergenhahn M, Kenzelmann M, Cohen CD, Bonrouhi M, Weninger A, et al. Decrease and gain of gene expression are equally discriminatory markers for prostate carcinoma: a gene expression analysis on total and microdissected prostate tissue. Am J Pathol. 2002 Jun;160(6):2169–80.
- Ståhl PL, Salmén F, Vickovic S, Lundmark A, Navarro JF, Magnusson J, et al. Visualization and analysis of gene expression in tissue sections by spatial transcriptomics. Science. 2016 Jul;353(6294):78–82.
- Femino AM, Fay FS, Fogarty K, Singer RH. Visualization of single RNA transcripts in situ. Science. 1998 Apr 24;280(5363):585–90.
- Chen A, Liao S, Cheng M, Ma K, Wu L, Lai Y, et al. Spatiotemporal transcriptomic atlas of mouse organogenesis using DNA nanoball-patterned arrays. Cell. 2022 May 12;185(10):1777-1792.e21.
- Wu L, Yan J, Bai Y, Chen F, Xu J, Zou X, et al. Spatially-resolved transcriptomics analyses of invasive fronts in solid tumors [Internet]. bioRxiv; 2021 [cited 2023 Feb 9]. p. 2021.10.21.465135. Available from: https://www.biorxiv.org/content/10.1101/2021.10.21.465135v1
- Pour M, Yanai I. New adventures in spatial transcriptomics. Dev Cell. 2022 May 23;57(10):1209–10.

